



primeimages/E+ via Getty Images
Capital Scarcity and the End of Globalization’s Disinflationary Era
The structural backdrop for U.S. inflation increasingly suggests that the long run equilibrium range is migrating from roughly 1.5–3.5% toward 3.5–4.5%, with a significant risk of episodes of inflation above 5%. An important core reason is the steady erosion of the disinflationary architecture that dominated the 1990–2020 period, even as various cyclical pressures also play a role.
Globalization’s Disinflationary Era (1990-2020)
The structural inflation outlook can be understood through the standard economic production function, where output is determined by labor, capital, technology, natural resources, and productivity growth. Following the collapse of the Iron Curtain and China’s integration into the global trading system, the world experienced one of the largest positive supply shocks in modern economic history. Hundreds of millions of low-cost workers entered the tradable global economy, multinational firms gained access to increasingly integrated global supply chains, and production became concentrated in large manufacturing hubs that generated substantial economies of scale. At the same time, falling capital costs, low-cost energy, and rapid technological diffusion reinforced productivity growth and expanded productive capacity.
Together, these forces shifted the aggregate supply curve outward, allowing the United States and other advanced economies to grow while inflationary pressures eased. The result was persistent disinflation in goods prices, downward pressure on wages in developed economies, lower inflation volatility, and an expanded capacity to absorb debt and liquidity without generating sustained pricing pressure.
Debt, Liquidity, and Disinflation in the Globalization Era
This framework also helps explain why rising debt was largely disinflationary during the globalization era. Debt servicing diverted income away from consumption, restraining aggregate demand growth, while expanding global productive capacity absorbed liquidity and credit expansion without generating broad pricing pressure.
Michael Spence and Kevin Warsh have argued that Fed actions led many corporate decision makers to believe that the central bank would support the prices and liquidity of financial assets, encouraging them to allocate an increasing share of their portfolios to financial assets while reducing investment in plant and equipment, investments that are critical to a rising standard of living.
Money velocity fell almost continuously during the era of globalization. M2 velocity declined from roughly 2.2 in 1997 to nearly 1.1 during the 2020 pandemic shock. Other Deposit Liabilities (ODL) velocity fell even more sharply, from approximately 3.6 in 2000 to roughly 1.5 during the pandemic. Expanding productive capacity, cheap labor, excess industrial capacity, and falling velocity allowed the economy to absorb large increases in debt and liquidity without sustained inflation.
The Production Function Turns Adverse
That framework is now reversing. Strategic rivalry with China, tariffs, friendshoring, semiconductor localization, and supply-chain redundancy are replacing the “lowest-cost producer” model with a “secure and resilient producer” model. The shift from “just-in-time” to “just-in-case” production structurally raises costs across manufacturing, logistics, and inventory management.
At the same time, many of the variables that once supported disinflation are now moving in the opposite direction. Labor supply growth is slowing, global scale efficiencies are fragmenting, capital requirements are rising due to industrial policy and artificial intelligence (AI) infrastructure investment, and geopolitical considerations are increasingly interfering with cost minimization. As production becomes more regionally fragmented and politically constrained, the United States is gradually losing some of the economies of scale that globalization once provided.
As a result, the productive capacity of the economy may no longer expand rapidly enough to absorb rising liquidity and credit growth without generating persistently higher inflation. Under these conditions, rising debt may no longer exert the same disinflationary influence as it did from 1990 to 2020. Instead of excess liquidity being absorbed by expanding global productive capacity, it may increasingly collide with labor shortages, energy constraints, infrastructure bottlenecks, and reduced economies of scale.
The U.S. labor market appears to be entering a more persistently supply-constrained regime. Demographic aging, slower labor-force growth, elevated retirement rates, and tighter immigration dynamics imply that labor scarcity may increasingly become structural rather than cyclical.
This matters because service inflation is fundamentally wage driven. Large service sectors such as healthcare, construction, hospitality, and education cannot be meaningfully offshored or rapidly automated. During the era of globalization, external labor competition restrained domestic wage bargaining power and helped suppress broad inflationary pressures.
With that force now weakening, wage gains are transmitting more directly into domestic prices. Even moderate labor shortages may therefore push inflation materially above the Fed’s historical 2% target.
The United States is increasingly emphasizing resilience, redundancy, and national security rather than pure economic efficiency. While these policies may strengthen long-run strategic capacity, they are also capital-intensive and structurally inflationary. Domestic semiconductor fabrication, energy-grid expansion, electrification, and defense manufacturing all require massive investment spending, large quantities of industrial commodities, and highly skilled labor, all of which are already in relatively short supply.
Artificial Intelligence: Productivity Gains Versus Structural Inflationary Pressures
While AI may ultimately generate meaningful productivity gains, those benefits may not fully offset the structural inflationary forces now emerging. AI is extraordinarily capital and energy-intensive, requiring massive investment in data centers, semiconductors, electrical transmission infrastructure, cooling systems, and high-performance computing hardware.
Large-scale AI deployment is expected to require enormous increases in power generation capacity at a time when the U.S. grid is already under strain from electrification trends, aging infrastructure, and underinvestment in baseload generation. The resulting increase in electricity demand may place sustained upward pressure on utility costs and infrastructure spending.
Capital Scarcity and the Return of Inflation Risk
Another important feature of the post-1990 globalization era was the persistent decline in inflation risk premiums throughout financial markets. As globalization expanded supply and suppressed labor costs, investors increasingly came to view inflation volatility as permanently subdued. This contributed to unusually low Treasury term premiums, historically low borrowing costs, and a prolonged expansion in financial asset valuations.
Industrial policy, supply-chain fragmentation, energy-transition investment, and geopolitical rivalry are increasing the economy’s capital intensity while simultaneously reducing some of the scale efficiencies that once restrained costs. At the same time, liquidity created through fiscal deficits and monetary accommodation may increasingly flow into nominal spending rather than remaining concentrated in financial assets.
The United States appears to be entering a period in which the demand for capital is rising far faster than the domestic supply of saving. Net national saving has fallen from a long-run average of roughly 6.8% of national income to near historic lows, just as the economy faces enormous investment requirements for AI, electric grid expansion, semiconductor manufacturing, energy infrastructure, reindustrialization, defense modernization, and space exploration. Because investment must ultimately be financed by either domestic saving or foreign capital, persistently low saving implies greater dependence on foreign financing, higher real interest rates, or the crowding out of productive investment. This imbalance may also create political and financial pressure on the Federal Reserve to accommodate growth by expanding the money supply in an effort to ease financing constraints. However, while monetary expansion can create additional liquidity, it cannot create the real saved resources needed for capital formation. As a result, such a policy could aggravate inflationary pressures and distort resource allocation without resolving the underlying shortage of capital, leaving the economy with both higher inflation and continued constraints on long-term growth.
Inflation, Balance Sheet Restraint, and Interest Rate Volatility
The structural shift toward a higher inflation environment has important implications for the path of long-term interest rates. The Fisher equation states that long-term Treasury yields are determined by three components: the real rate of return, expected inflation, and a risk premium demanded by investors for holding long-duration securities.
During the 1990–2020 globalization era, inflation expectations steadily declined, global saving restrained real interest rates, and Treasury term premiums remained exceptionally low. The emerging environment now appears fundamentally different. If equilibrium inflation is shifting from roughly 1.5–3.5% to 3.5–4.5%, then the inflation component embedded in Treasury yields would tend to rise. Real interest rates may also face upward pressure from rising capital demands associated with industrial policy, energy-transition investment, AI infrastructure buildouts, defense spending, space endeavors, and the fragmentation of globalization.
The Fed’s New Regime
Conclusions about nonmonetary factors in this era must be qualified by the likely direction of Federal Reserve policy under Chairman Kevin Warsh. A smaller Federal Reserve balance sheet would reduce the likelihood that future fiscal deficits are indirectly financed through central-bank asset purchases. Balance sheet restraint would therefore represent an important monetary offset to fiscal expansion. Rather than allowing monetary expansion to accommodate rising federal borrowing needs, quantitative tightening would force a larger share of Treasury financing onto private markets.
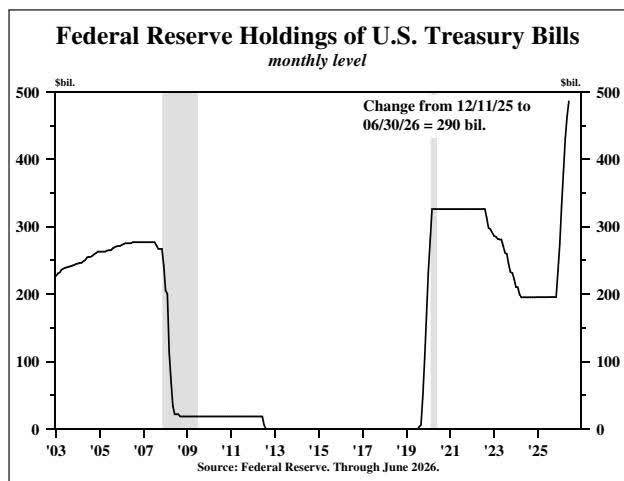
Chart 1
Source: Federal Reserve.
Table 1
Two major monetary developments worsen the challenges facing Mr. Warsh. First, by the first quarter of 2026, M2 velocity had recovered to approximately 1.41, while ODL velocity had rebounded to roughly 1.9, suggesting that liquidity created during the pandemic was no longer remaining dormant within the financial system to the same extent as during the post-2008 period. Second, substantial liquidity injection occurred from mid-December 2025 through June 2026. In this period, the Federal Reserve purchased approximately $290 billion of Treasury securities (Chart 1), igniting a surge in bank deposits and loans. ODL rose at a torrid 8.9% annualized rate in this year’s first six months (Table 1)—more than 1.6 times faster than its ten-year compounded growth rate. Indeed, this Fed driven liquidity event, along with the recovery in velocity, may explain a sharp February reacceleration in inflation prior to the latest geopolitical energy shock.
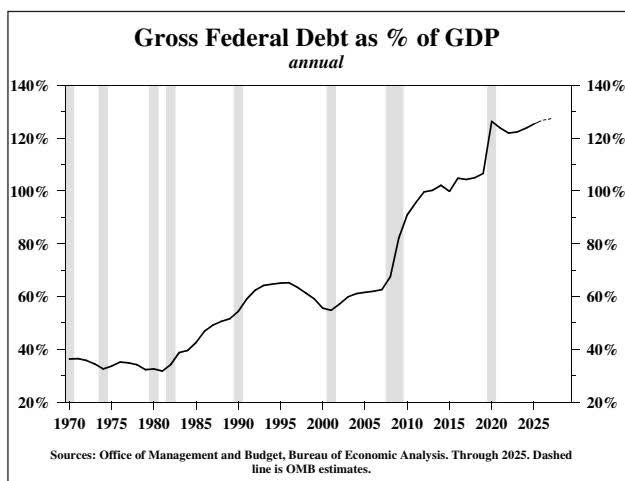
Chart 2
As a result, Chairman Warsh inherits an immediate situation where money growth needs to materially slow if Fed policy is to avoid reinforcing inflationary momentum. The challenge is that the short-run financial effects of balance sheet reduction may differ substantially from the longer-run inflation effects. Markets that have become accustomed to abundant liquidity may initially experience tighter financial conditions, while the eventual disinflationary benefits of monetary restraint may emerge only with a considerable lag.
Higher real rates, tighter financial conditions, and reduced liquidity growth would likely restrain aggregate demand, credit creation, and asset-price inflation. Over time, this restraint could reduce inflationary pressure and eventually lower nominal interest rates if inflation expectations decline sufficiently.
The result is not a simple forecast of continuously rising interest rates, but rather a more volatile interest-rate regime. In the near term, balance sheet reduction could raise term premiums and real yields as markets absorb greater Treasury supply without Federal Reserve support. Over the longer term, however, if tighter monetary conditions successfully suppress inflation, the inflation component of nominal yields could fall, partially or fully offsetting the earlier rise in real rates and term premiums. If this new policy regime is not pursued, structural inflation will remain unchecked.
Persistent increases in gross U.S. federal debt relative to GDP (Chart 2) could boost debt-service costs through a channel that is not widely appreciated. Drawing on extensive archival research of fiscal policy and economic conditions, Hoover Institution historian Niall Ferguson formulated “Ferguson’s Law,” which holds that great powers risk decline when debt-service costs exceed military spending. Interest expense is more of a reflection of past fiscal policy failure rather than an indicator of future economic activity. As debt levels rise relative to the size of the economy and fiscal flexibility diminishes, investors may increasingly demand a higher risk premium on Treasury securities, placing upward pressure on long-term interest rates.
As a result, the post-globalization interest-rate environment is likely to be less stable than the one that prevailed from 1990 to 2020. Recessions, financial crises, technological breakthroughs, or successful balance sheet restraint could still produce periods of lower inflation and declining interest rates. However, absent a sustained recession, a favorable supply-side shock, or a prolonged period of monetary restraint, the broader structural backdrop—larger fiscal deficits, higher capital demands, fragmented supply chains, reduced globalization efficiencies, and greater sensitivity to Treasury supply—suggests that both inflation and long-term Treasury yields will trend upward.
Van R. Hoisington
Lacy H. Hunt, Ph.D.
Original Post
Editor’s Note: The summary bullets for this article were chosen by Seeking Alpha editors.
